Grafana series (XII): How to use Loki to create a Grafana dashboard for searching logs
This article was last updated on: March 10, 2026 am
overview
Create a simple Grafana dashboard to enable quick search of logs.
Experienced directly use Grafana’s Explore feature on it.
But for the inexperienced people, how can they have a dashboard that is already preset with a simple tag search to help some teams quickly find what they are looking for when troubleshooting. While Explore is great for this use case, it can also be a bit intimidating for first-time users, or for people who receive alerts in the middle of the night.
So, try using some template variables to create a Grafana dashboard that displays logs.
steps
Implementation overview
Create a Logs Panel dashboard, then add a few variables that the Logs Panel’s LogQL expression introduces.
Create variables
Because Loki and Prometheus share a set of labels, they can be used as variables for Loki by Prometheus’ Label. As shown in the following figure:
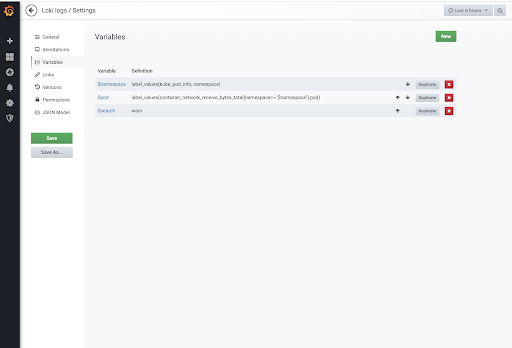
Here one can be created by: namespace, pod, 日志过滤条件 Dashboard to filter logs:
namespacevariable, through which all are obtainednamespaceAs a variable filter:- Type:
Query - DataSource: Prometheus
- Query:
label_values(kube_pod_info, namespace)
- Type:
podvariable, by which the correspondence is obtainednamespacelowerpodFilter criteria as variables to narrow the log search space:- Type:
Query - DataSource: Prometheus
- Query:
label_values(container_network_receive_bytes_total{namespace=~"$namespace"},pod) - Multi-value: checked;
- Include All option: Checked
- Custom all value:
.* - 🐾 Note, use
container_network_receive_bytes_totalUse the metric name to look for available pods, but you can use any metric to represent all pods in your environment.
- Type:
searchvariable, through which the variable acts as a pipe filter condition for LogQL, which is used to actually perform the search:- Type:
Text Box - Default value:
rror(Hit.)Errororerror)
- Type:
Perform LogQL
Finally, concatenate the above variables, add the Logs Panel, use Loki as the data source, and use{namespace="$namespace", instance=~"$pod"} |~ "$search" As LogQL. As follows:
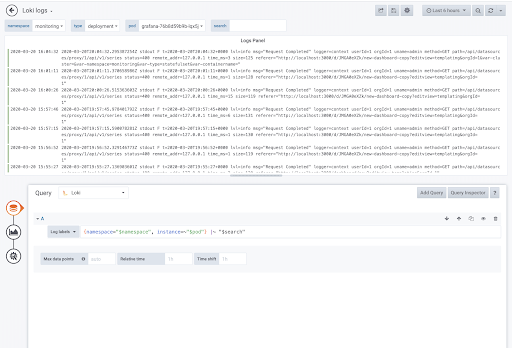
All of this adds up to a nice and simple interface for searching logs – unfamiliar people don’t even need to write a LogQL query!
If you want to check it out, here’s the dashboard json
Do another one to view the Journal log
Again, do another look at the Journal log:
Create variables
Use Loki’s Label directly here.
Here one can be created by: hostname, unit, 日志过滤条件 Dashboard to filter logs:
hostnamevariable, through which all are obtainedhostnameAs a variable filter:- Type:
Query - DataSource: Loki
- Query:
label_values(hostname) - Multi-value: Checked
- Include All option: Checked
- Custom all value:
.+
- Type:
unitvariable, by which the correspondence is obtainedhostnamelowerunitFilter criteria as variables to narrow the log search space:- Type:
Query - DataSource: Loki
- Query:
label_values({hostname=~"$hostname"}, unit) - Multi-value: checked;
- Include All option: Checked
- Custom all value:
.+ - 🐾 Note, use
container_network_receive_bytes_totalUse the metric name to look for available pods, but you can use any metric to represent all pods in your environment.
- Type:
searchvariable, through which the variable acts as a pipe filter condition for LogQL, which is used to actually perform the search:- Type:
Text Box - Default value:
rror(Hit.)Errororerror)
- Type:
Perform LogQL
Finally, concatenate the above variables, add the Logs Panel, use Loki as the data source, and use{hostname=~"$hostname", unit=~"$unit"} |~ "$search" As LogQL. As follows:
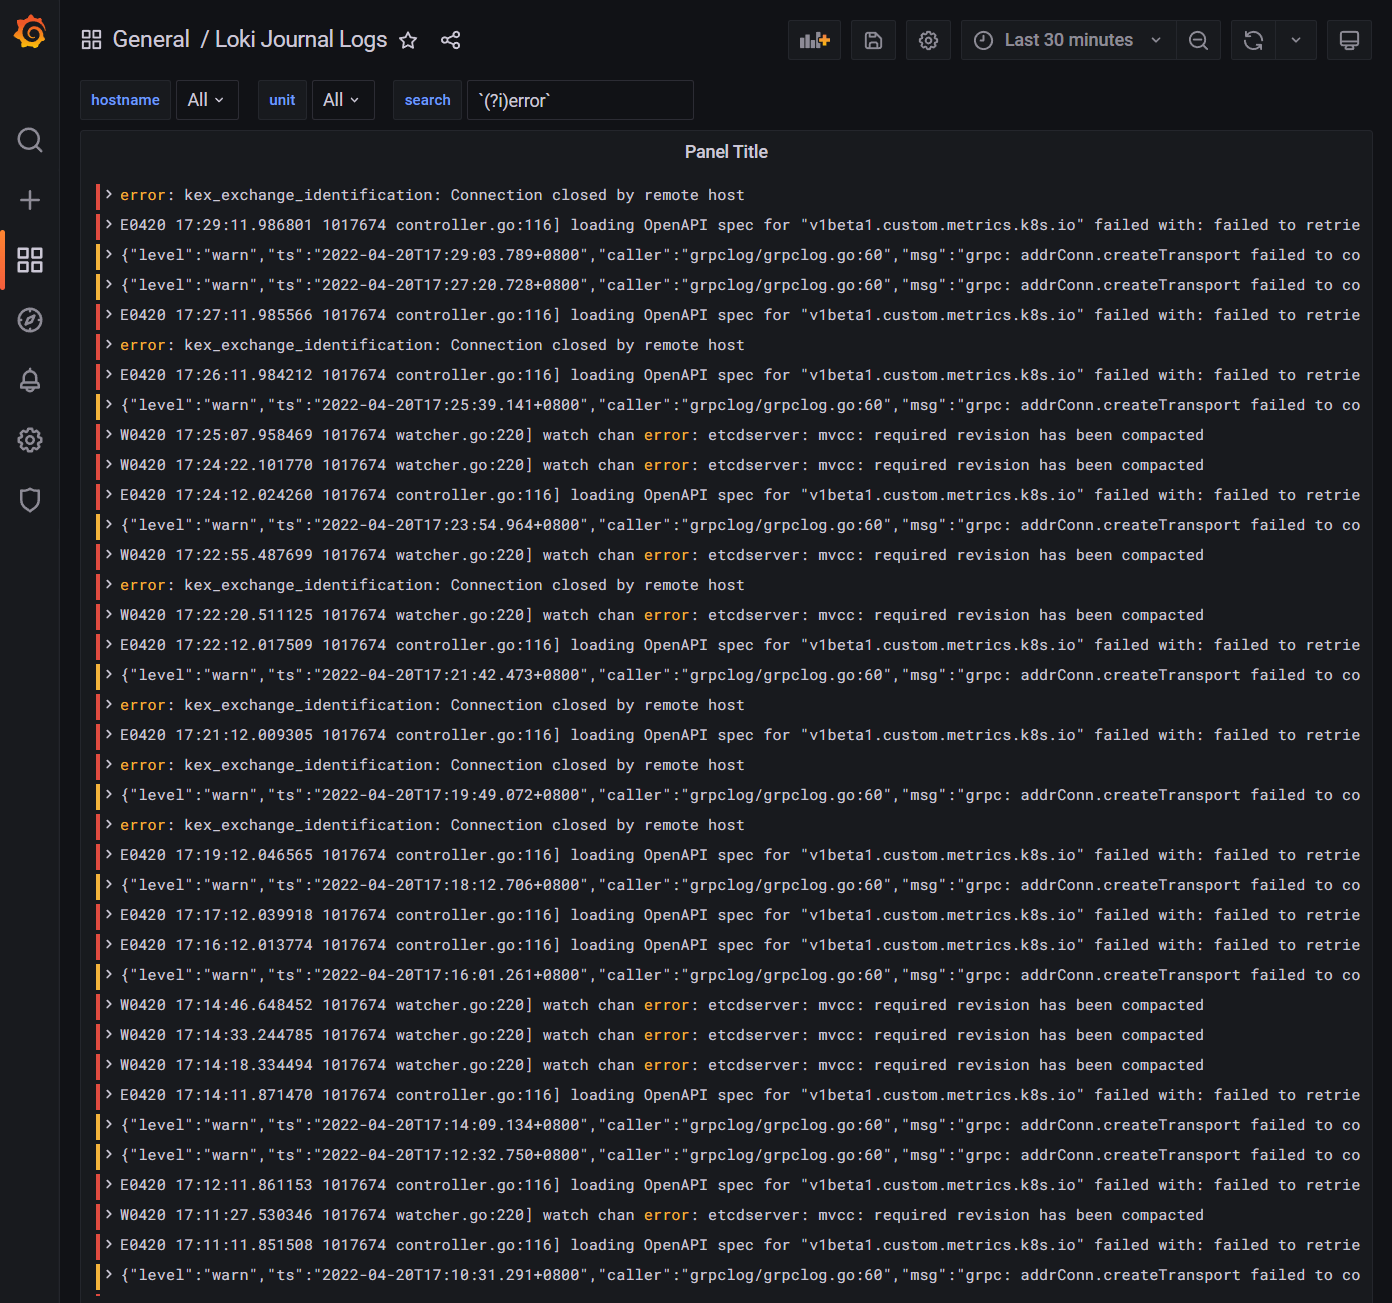
The final effect
The end effect is as follows:
and as follows:
🎉🎉🎉